
Bachelor Thesis: The Gumbel Max-Domain of Attraction in Extremes
In the following I present an easy and digestable introduction to the topic of my Bachelor’s thesis (Link).
When are Extremes Truly Extreme?
Records are broken every year; whether in temperatures, rainfall, financial crashes, or athletic performances. Understanding the behavior of extremes is not just an academic curiosity; it has tangible consequences for risk assessment, infrastructure planning, and financial stability. But how do we determine how extreme an event can be?
This is where extreme value theory (EVT) provides a rigorous framework. While traditional statistics focuses on averages and variances, EVT examines the largest (or smallest) values in a dataset. Remarkably, extreme events across many domains tend to follow a small set of universal probability distributions-think of it as a pendant to the central limit theorem (sums of observations are basically distributed like a Gauss-distribution). One of these, the Gumbel distribution, frequently appears when dealing with maxima.
The Gumbel Maximum Domain of Attraction – What’s Behind It?
A fundamental question in EVT is: Under what conditions does a given distribution lead to its maxima following the Gumbel distribution? This is more than a theoretical exercise, it has direct applications in fields ranging from climate science to material engineering and finance.
Indeed, many real-world phenomena can be described using the Gumbel distribution (or its transformed versions). Some notable examples include:
- Extreme temperatures – The annual maximum temperature in a given region often follows a Gumbel distribution, helping climatologists predict future heatwaves.
- Flood risk modeling – River discharge extremes are often well-modeled by Gumbel-type distributions, informing the design of dams and flood barriers.
- Precipitation – In many locations after taking the precipitation to the power of 3/2 the precipitation is of Gumbel-type.
- Structural engineering failures – The maximum stress a material can withstand before breaking often fits within the Gumbel domain, crucial for safety assessments.
Mathematically, a distribution belongs to the maximum domain of attraction of the Gumbel distribution if its normalized maxima converge to a Gumbel distribution as sample size increases. But how can we verify this condition efficiently, and how can we improve upon standard methods? That was the focus of my research.
Visualization: How Extremes Behave
To make this idea more tangible, consider the following simulation. Below, we observe how the maxima of samples drawn from a normal distribution behave as the sample size increases:
# R code for visualizing the Gumbel approximation
set.seed(42)
n <- 1000
maxima <- replicate(n, max(rnorm(100)))
hist(maxima, probability = TRUE, breaks = 30, main = "Maxima from Normal Distributions",
     xlab = "Max Values", col = "lightblue")
curve(dnorm(x, mean = mean(maxima), sd = sd(maxima)), add = TRUE, col = "red", lwd = 2)
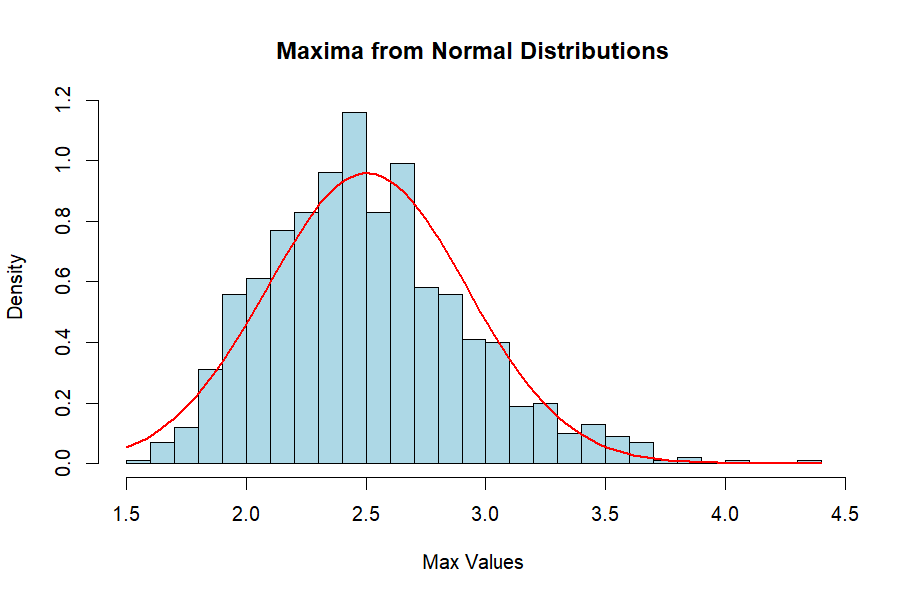
This plot illustrates a fundamental property: As the sample size grows, the distribution of the observed maxima approaches a predictable form—one that, under the right conditions, converges to the Gumbel distribution.
Why This Matters
By refining the characterization of the Gumbel maximum domain of attraction, my research provides a more direct and verifiable condition for identifying whether a dataset follows this pattern.
If you’d like to learn more and understand the mathematics behind it in depth, feel free to check the full work; please note, it is available only in the German language: Thesis.